Persistence Atlas for Critical Point Variability in Ensembles
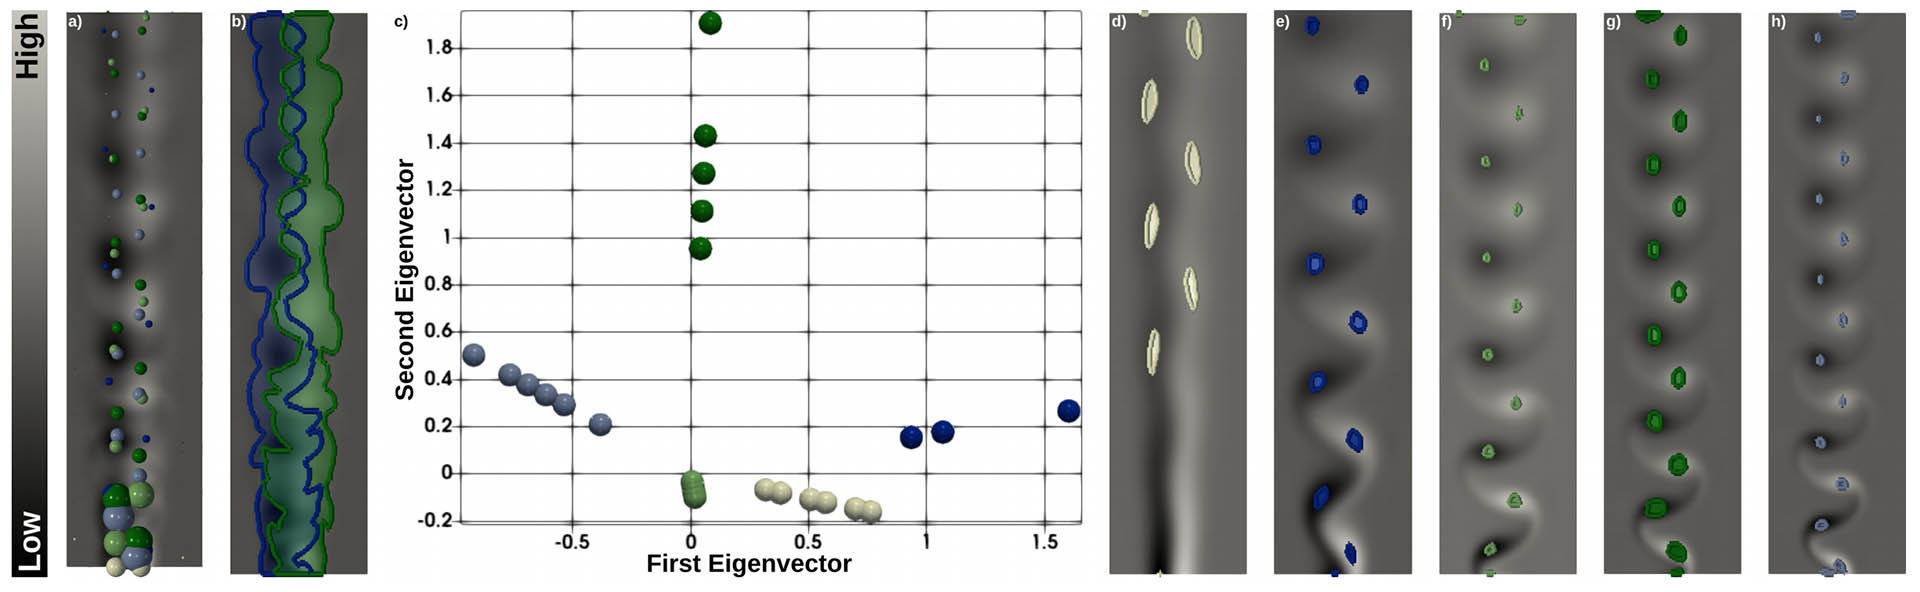 Persistence atlas for an ensemble of 45 von Karman vortex streets (scalar data: orthogonal component of the curl). (a) Critical
points (minima and maxima, scaled by persistence) of a few representative ensemble members (one color per member) exhibit clearly
distinct layout patterns in terms of position and number of vortices, revealing high spatial and trend variabilities within the ensemble. (b)
Mandatory critical points (minimal regions where at least one critical point is guaranteed to occur for every member of the ensemble)
are thus particularly conservative given these variabilities and identify only one region per side of the vortex street (blue: minimum,
green: maximum). (c) The persistence atlas addresses this issue by analyzing the structure of the ensemble in terms of critical point
layouts and provides low dimensional embeddings of the members where statistical tasks, such as clustering, can be easily carried
out. In particular, our approach automatically identified five clusters, (d) to (h), corresponding to five distinct trends in critical point
layouts (five viscosity regimes). Per cluster mandatory critical points provide more accurate and useful critical point predictions (colored
regions, (d) to (h)), revealing an increasing number of vortices and a decreasing spatial variability for increasing Reynolds numbers (left
to right). The background color map shows the mean scalar field for the entire ensemble, (a) and (b), and individual clusters, (d) to (h).
Persistence atlas for an ensemble of 45 von Karman vortex streets (scalar data: orthogonal component of the curl). (a) Critical
points (minima and maxima, scaled by persistence) of a few representative ensemble members (one color per member) exhibit clearly
distinct layout patterns in terms of position and number of vortices, revealing high spatial and trend variabilities within the ensemble. (b)
Mandatory critical points (minimal regions where at least one critical point is guaranteed to occur for every member of the ensemble)
are thus particularly conservative given these variabilities and identify only one region per side of the vortex street (blue: minimum,
green: maximum). (c) The persistence atlas addresses this issue by analyzing the structure of the ensemble in terms of critical point
layouts and provides low dimensional embeddings of the members where statistical tasks, such as clustering, can be easily carried
out. In particular, our approach automatically identified five clusters, (d) to (h), corresponding to five distinct trends in critical point
layouts (five viscosity regimes). Per cluster mandatory critical points provide more accurate and useful critical point predictions (colored
regions, (d) to (h)), revealing an increasing number of vortices and a decreasing spatial variability for increasing Reynolds numbers (left
to right). The background color map shows the mean scalar field for the entire ensemble, (a) and (b), and individual clusters, (d) to (h).
This paper presents a new approach for the visualization and analysis of the spatial variability of features of interest
represented by critical points in ensemble data. Our framework, called Persistence Atlas, enables the visualization of the dominant
spatial patterns of critical points, along with statistics regarding their occurrence in the ensemble. The persistence atlas represents in
the geometrical domain each dominant pattern in the form of a confidence map for the appearance of critical points. As a by-product,
our method also provides 2-dimensional layouts of the entire ensemble, highlighting the main trends at a global level. Our approach is
based on the new notion of Persistence Map, a measure of the geometrical density in critical points which leverages the robustness
to noise of topological persistence to better emphasize salient features. We show how to leverage spectral embedding to represent
the ensemble members as points in a low-dimensional Euclidean space, where distances between points measure the dissimilarities
between critical point layouts and where statistical tasks, such as clustering, can be easily carried out. Further, we show how the
notion of mandatory critical point can be leveraged to evaluate for each cluster confidence regions for the appearance of critical
points. Most of the steps of this framework can be trivially parallelized and we show how to efficiently implement them. Extensive
experiments demonstrate the relevance of our approach. The accuracy of the confidence regions provided by the persistence atlas is
quantitatively evaluated and compared to a baseline strategy using an off-the-shelf clustering approach. We illustrate the importance of
the persistence atlas in a variety of real-life datasets, where clear trends in feature layouts are identified and analyzed. We provide a
lightweight VTK-based C++ implementation of our approach that can be used for reproduction purposes.


@article{8457259,
         author={G. Favelier and N. Faraj and B. Summa and J. Tierny},
         journal={IEEE Transactions on Visualization and Computer Graphics},
         title={Persistence Atlas for Critical Point Variability in Ensembles},
         year={2019},
         volume={25},
         number={1},
         pages={1152-1162},
         doi={10.1109/TVCG.2018.2864432},
         ISSN={1077-2626},
         month={Jan}
         }