Visualizing Topological Importance: A Class-Driven Approach
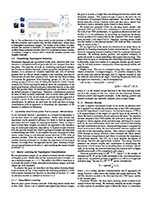
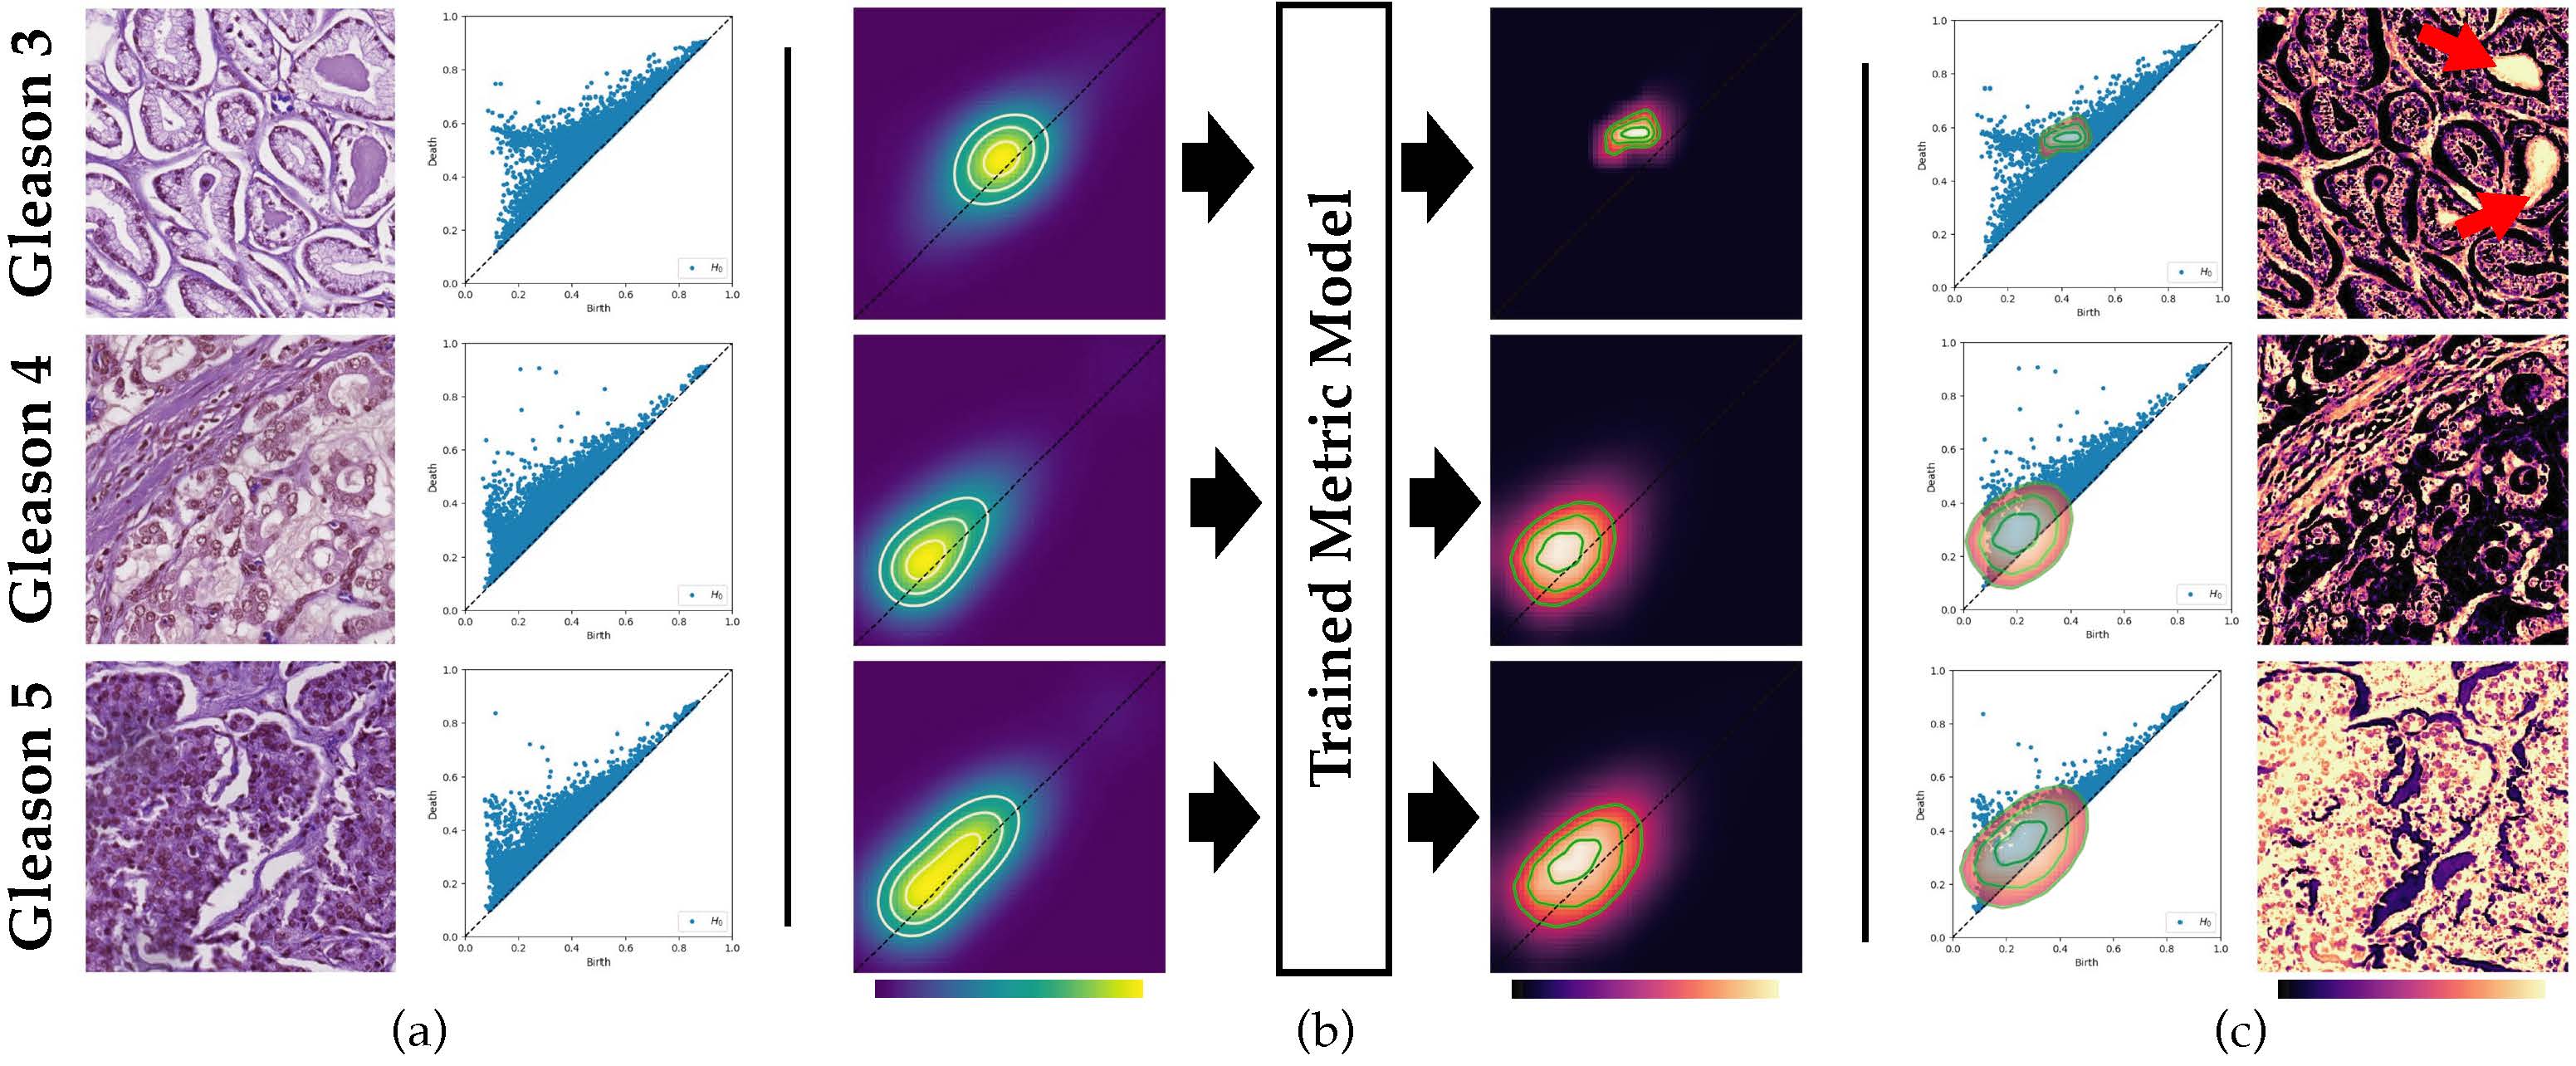 (a) A common task in topological data analysis: extracting a persistence diagram of topological features. In this case, features
are based on the sublevel set filtration of pathology images with class labels (Gleason grade) that define the progression of prostate
cancer. Knowing which features are important for each class is commonly an educated guess with the lifetime of a feature
(persistence) often assumed to define importance. (b) Our approach, based on a learned metric classifier, takes as input the unweighted
density of persistence points and reweighs this density based on what best defines a class. This allows us to build a field of importance
for regions of a diagram. (c) This importance field can be used to create visualizations to illuminate which features drive a classification.
For example, it can highlight what points are important directly in a diagram or, in the case of sublevel set filtrations, visualize the
important structure directly in an image. Consider that a hallmark of prostate cancer is gland degeneration as the disease progresses.
Calcifications (red arrow) are only present in well-structured glands and are highlighted as important structures for Gleason 3, an
earlier stage of the disease.
(a) A common task in topological data analysis: extracting a persistence diagram of topological features. In this case, features
are based on the sublevel set filtration of pathology images with class labels (Gleason grade) that define the progression of prostate
cancer. Knowing which features are important for each class is commonly an educated guess with the lifetime of a feature
(persistence) often assumed to define importance. (b) Our approach, based on a learned metric classifier, takes as input the unweighted
density of persistence points and reweighs this density based on what best defines a class. This allows us to build a field of importance
for regions of a diagram. (c) This importance field can be used to create visualizations to illuminate which features drive a classification.
For example, it can highlight what points are important directly in a diagram or, in the case of sublevel set filtrations, visualize the
important structure directly in an image. Consider that a hallmark of prostate cancer is gland degeneration as the disease progresses.
Calcifications (red arrow) are only present in well-structured glands and are highlighted as important structures for Gleason 3, an
earlier stage of the disease.

Demi Qin

Brittany Terese Fasy

Carola Wenk

Brian Summa
This paper presents the first approach to visualize the importance of topological features that define classes of data. Topological
features, with their ability to abstract the fundamental structure of complex data, are an integral component of visualization and analysis
pipelines. Although not all topological features present in data are of equal importance. To date, the default definition of feature
importance is often assumed and fixed. This work shows how proven explainable deep learning approaches can be adapted for use in
topological classification. In doing so, it provides the first technique that illuminates what topological structures are important in each
dataset in regards to their class label. In particular, the approach uses a learned metric classifier with a density estimator of the points
of a persistence diagram as input. This metric learns how to reweigh this density such that classification accuracy is high. By extracting
this weight, an importance field on persistent point density can be created. This provides an intuitive representation of persistence
point importance that can be used to drive new visualizations. This work provides two examples: Visualization on each diagram directly
and, in the case of sublevel set filtrations on images, directly on the images themselves. This work highlights real-world examples of
this approach visualizing the important topological features in graph, 3D shape, and medical image data.
TBD